
Energy
Power & invoice intelligence
AI reads every supplier invoice, reconciles invoiced energy against measured site consumption, and queues the discrepancies for review. Energy stops being a line item and becomes an observable system.
CETIN SK — production
39 GWh
of invoiced energy under reconciliation — 39,009,665 kWh in the live deployment
Hundreds
of supplier invoices parsed automatically — PDFs, scans, spreadsheets
Site-level
delta between invoiced and measured kWh, with a tolerance-ranked review queue
At a glance
Status: Live
Deployed at: CETIN SK — production
Domain: Energy
Built with: Invoice OCR + LLM extraction · ELTEK & Ericsson telemetry · BitSwan pipelines
What it does
Two data streams that have never met are joined per site and per month:
What suppliers bill — extracted automatically from invoices by an AI reading pipeline. PDFs, scans, spreadsheets; hundreds of supplier invoices in incompatible formats become one clean dataset.
What sites actually consume — measured telemetry from ELTEK power systems and Ericsson equipment.
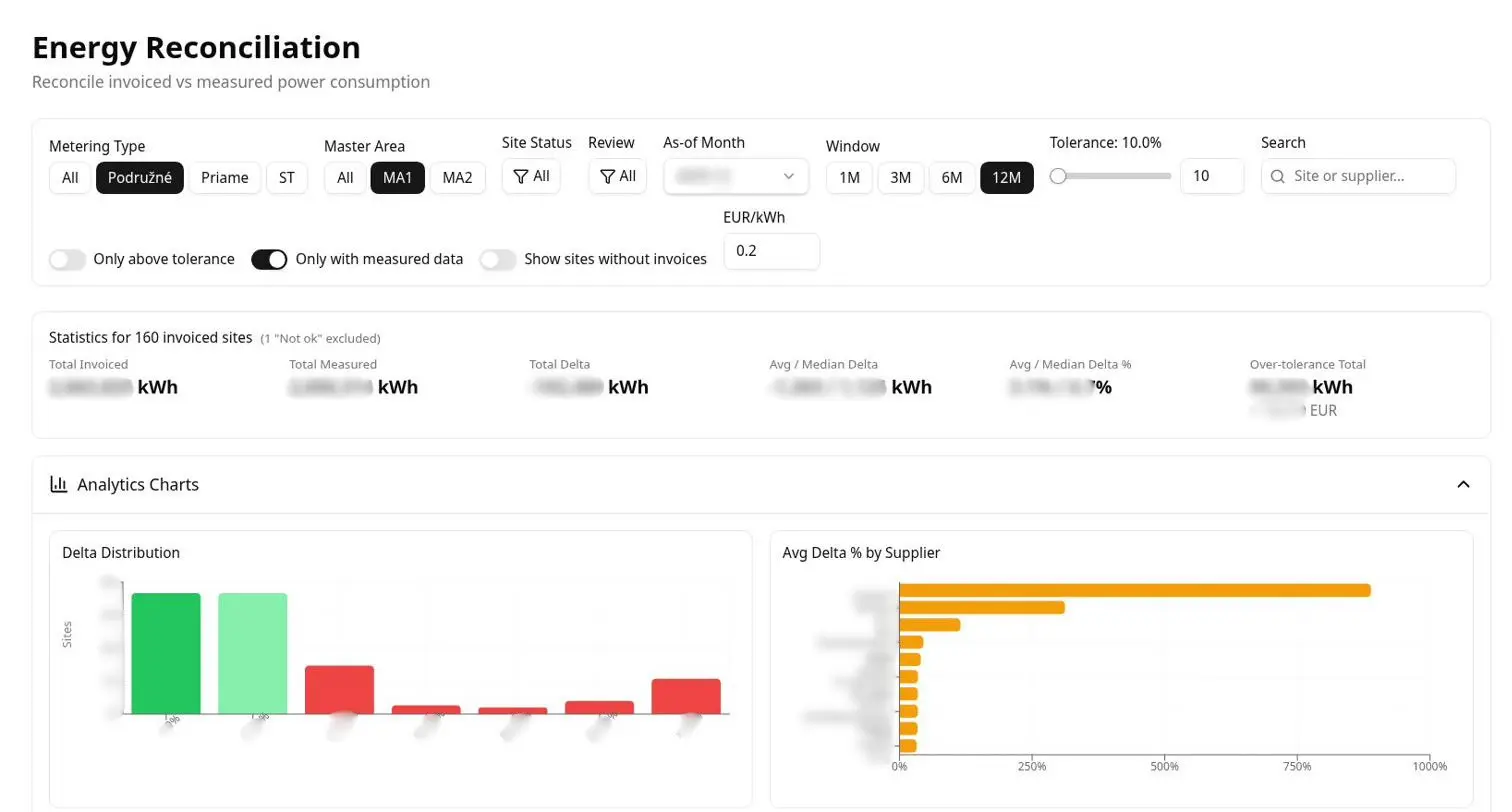
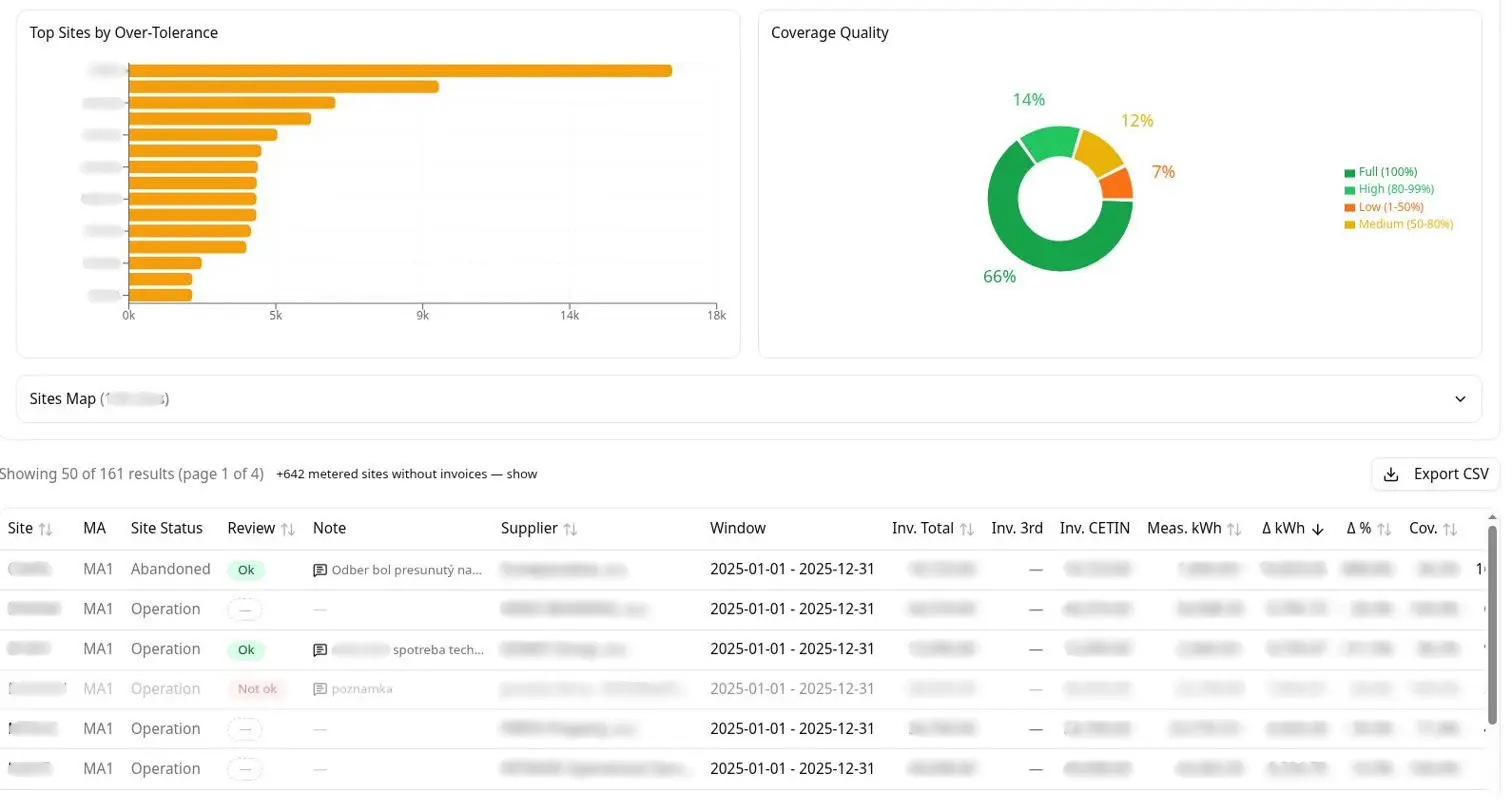
The reconciliation dashboard shows the delta for every site, ranks the worst offenders against a configurable tolerance, and tracks each case through an Ok / Not ok / Resolving review workflow.
Why it matters
Energy is one of the largest operating costs of a network, and for most operators it is verified by sampling — if at all. Once invoiced and measured kWh sit in the same table, the questions answer themselves: Which sites are billed for far more than they draw? Where is metering broken or missing? Which supplier’s invoices never quite add up?
“This is amazing. I have never seen data combined from such sources the way you did it.”
CFO · telco operator
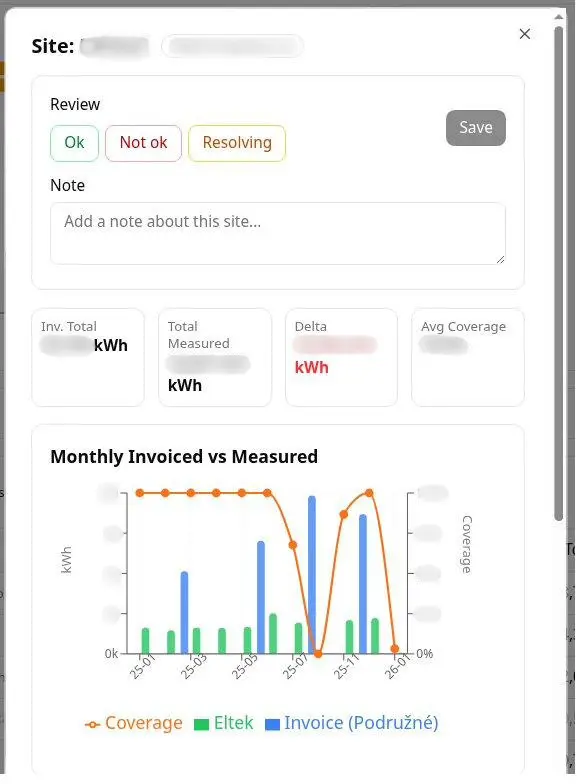
In the live deployment, a single drill-down can show a site invoiced 30,700 kWh against 16,937 kWh measured — the kind of discrepancy that pays for the system the day it is found.
How it works
Read. An AI extraction pipeline parses incoming invoices into structured records: supply point, period, consumption, price components.
Measure. BitSwan connectors stream per-site consumption from ELTEK and Ericsson sources.
Join. Pipelines align both streams by site and billing period, computing deltas and data-coverage quality (so a gap in telemetry is never mistaken for a billing problem).
Review. The dashboard’s tolerance-ranked queue feeds a simple resolution workflow with notes and status, shared between energy management and operations.
Why it replicates
The pattern — typified vs. real consumption, invoice extraction, reconciliation — was proven as a proof of concept first and then hardened into the production system running at CETIN SK. Every operator has the same two inputs (invoices and some form of site telemetry), which is all the system needs.
From the live system
Screenshots
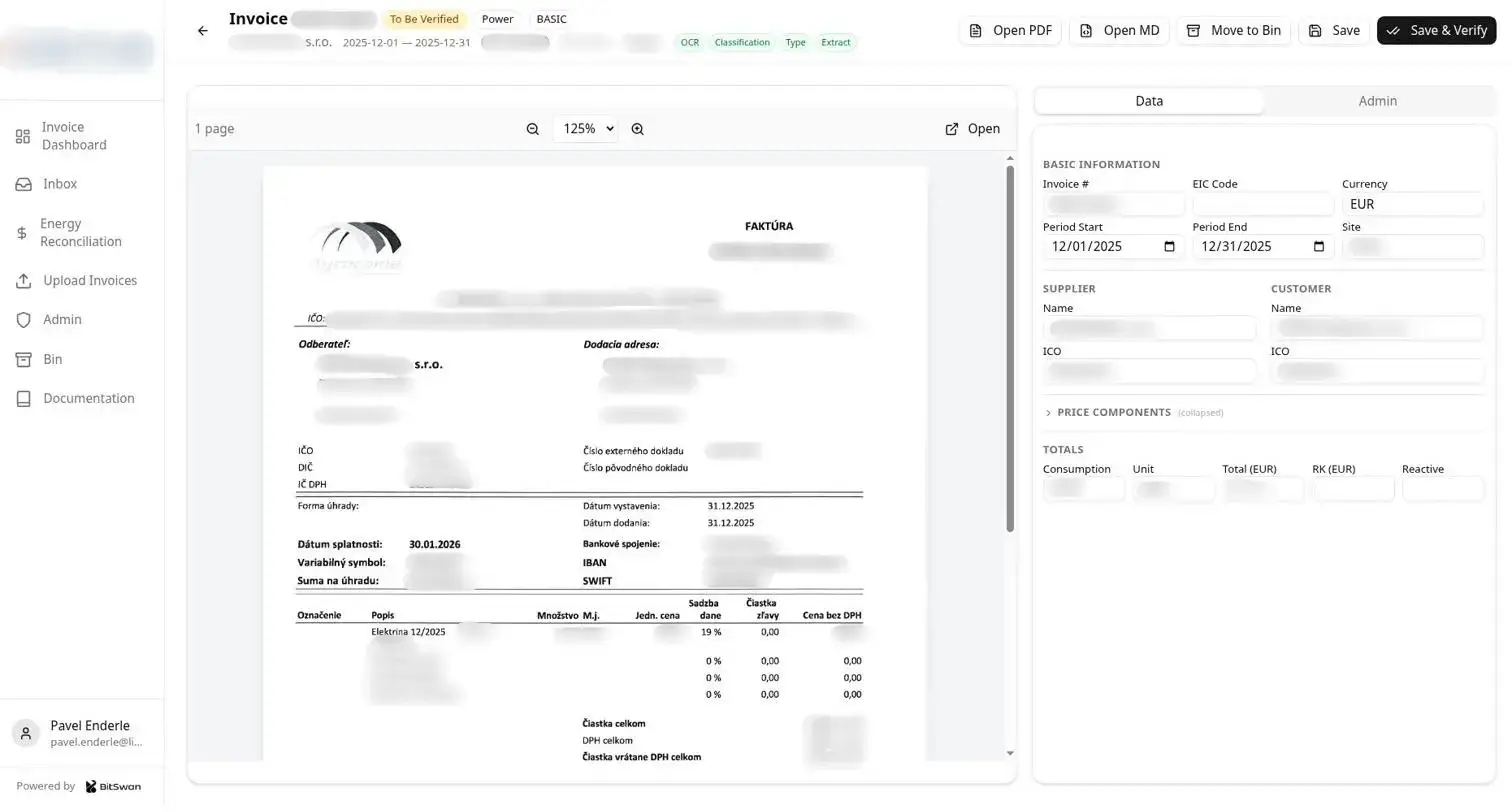
Invoice extraction. AI pulls structured data — supply points, periods, kWh, amounts — out of supplier invoices in any format. Hundreds of invoices processed automatically.
Energy reconciliation. Invoiced vs. measured consumption across 160 invoiced sites: delta distribution, data coverage by supplier, totals at a glance.
Site drill-down. One site, one story: 30,700 kWh invoiced vs. 16,937 kWh measured — a 13,763 kWh delta flagged for review with an Ok / Not ok / Resolving workflow.
Screenshots come from the production system and will be anonymised before public launch.
See it on your data.
A 60-minute walkthrough of the live use cases — and a frank conversation about which of them would land first on your network.