Energy · Network
Power outage detection
Mains-power loss detected at the site level and mapped across the country in real time — so the NOC sees the grid event behind the network event.
CETIN SK — production
Real-time
detection of mains loss per site from power-system telemetry
Battery-aware
feeds the battery-intelligence use case: who survives this outage, and for how long
Map view
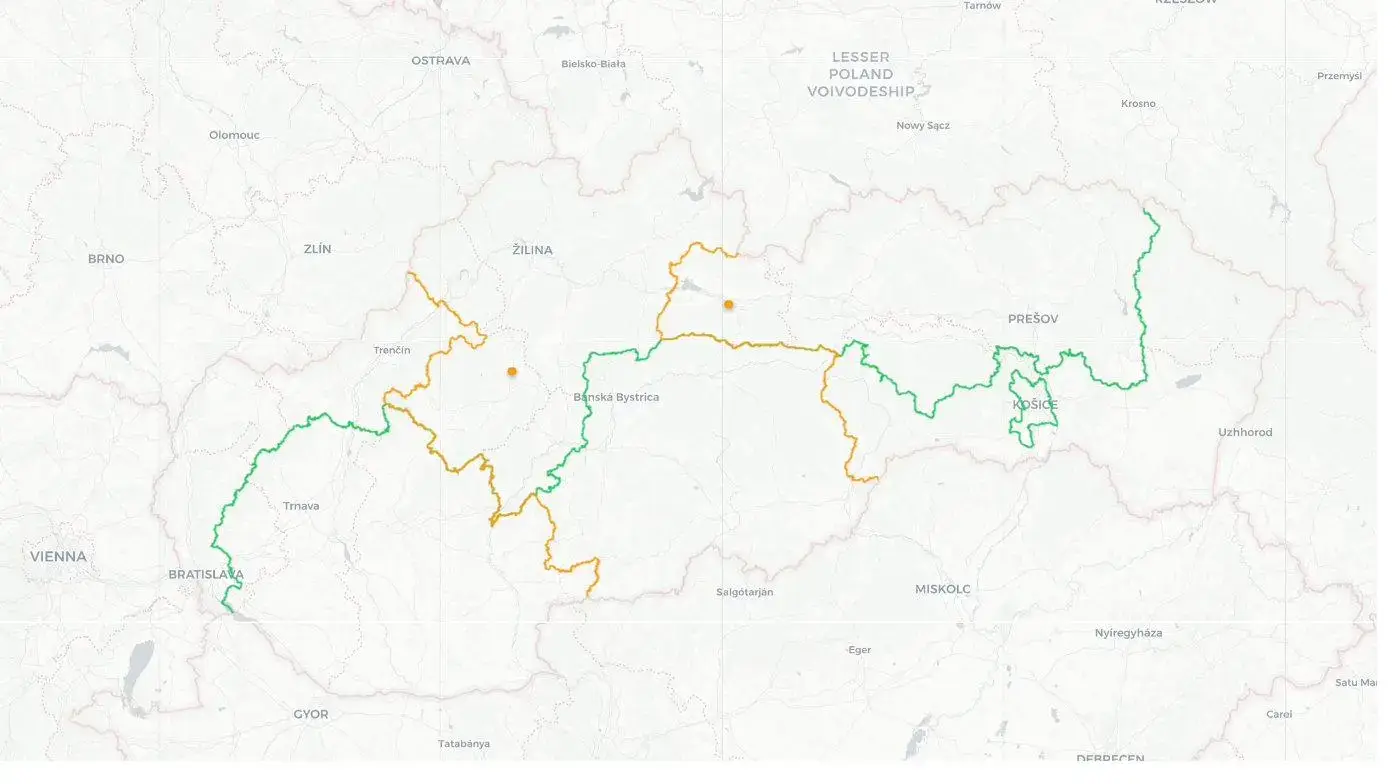
regional clustering makes grid-level events visible immediately
At a glance
Status: Live
Deployed at: CETIN SK — production
Domain: Energy · Network
Built with: ELTEK telemetry · Site alarms · BitSwan pipelines
What it does
Power-system telemetry (ELTEK and site alarms) is monitored continuously for loss of mains. Each event is recorded with its site, region, start time and duration, shown both as a working list and on a country map where regional clusters stand out instantly.
Why it matters
When a storm takes out a distribution feeder, the NOC traditionally finds out as a wave of unrelated-looking site alarms. Seen on the power map, the same wave is one event with one cause — which changes the response: contact the utility, prioritise sites by battery autonomy and customer impact, and brief support before the calls arrive.
Combined with battery intelligence, the question shifts from “what just went dark?” to “which of these sites will go dark in the next two hours unless a generator gets there?”
How it works
BitSwan connectors stream ELTEK power measurements and site alarms into Kafka; pipelines classify mains-loss events, deduplicate flapping supplies, and attach region and site metadata. The list and map are served as a BitSwan application sharing its data with the outage suite and TESU.
Why it replicates
Any operator with managed power systems at sites has the needed telemetry. The detection logic and map application are reusable; the connector layer adapts to whichever power-system vendor is on your sites.
From the live system
Screenshots
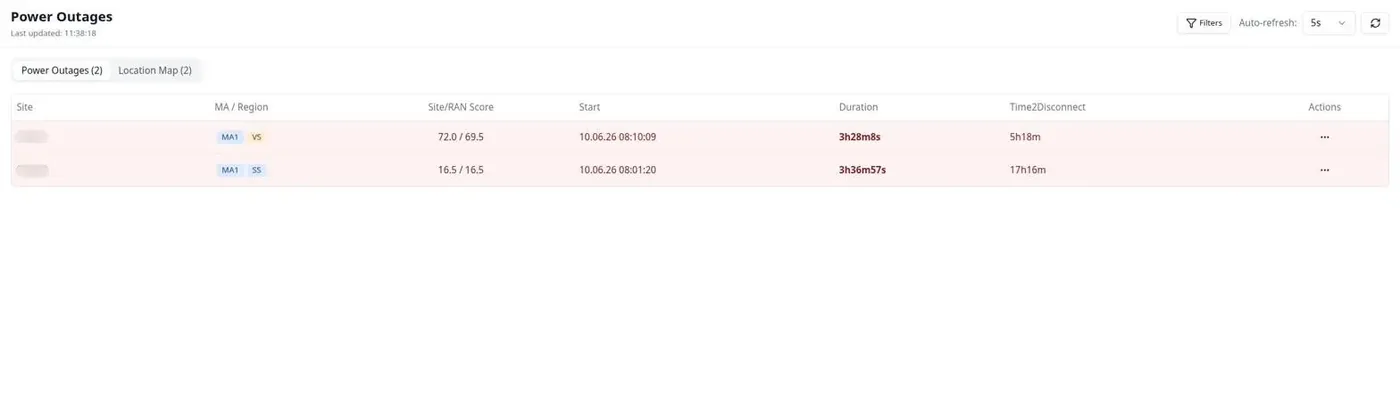
Power outage list.Sites currently on battery or dark: region, start time, duration and resolution status.
The grid view.Outages plotted across Slovakia — a cluster on the map is a distribution-grid event, not a coincidence of site alarms.
Screenshots come from the production system and will be anonymised before public launch.
See it on your data.
A 60-minute walkthrough of the live use cases — and a frank conversation about which of them would land first on your network.