
Network
RAN & transport anomaly detection
A dedicated ML model for every network element across key metrics in 2G/4G/5G and transport. Deviations are correlated across KPIs, filtered for persistence, and handed to operators with one-click feedback.
CETIN SK — production
1 model
per network element × metric — trained on each cell's own history
2G · 4G · 5G
plus transport (TWAMP) — voice, data, signalling and latency KPIs
2 h
persistence window before alerting — short blips never page anyone
At a glance
Status: Live
Deployed at:CETIN SK — production
Domain:Network
Built with:Kafka · Elasticsearch · SciPy / KDE · BitSwan pipelines
How it works
Ingest. RAN KPI streams (Ericsson today; the connector pattern covers Nokia and Huawei) land in Kafka through BitSwan ingestors.
Learn. For each cell × metric, a kernel-density model (SciPy KDE) is trained on a rolling month of history from Elasticsearch, and re-trained weekly so models track the network as it changes.
Score. Live values are scored against the model in real time; scores are published back to Kafka for downstream consumers.
Filter. A time-window analyzer requires the deviation to persist (typically 2 hours) before raising an incident — the single biggest false-alarm killer.
Review. Operators classify incidents as Legitimate / Suspicious / Anomaly in the dashboard. The feedback is stored with the events and tunes what surfaces next.
Why it replicates
Nothing in the design is CETIN-specific: the connectors, the per-element modeling, the persistence filter and the review loop are all reusable BitSwan modules. Bringing this to another operator means pointing the ingestors at your KPI feeds and letting the models train on your history — the system calibrates itself to your network by construction.
From the live system
Screenshots
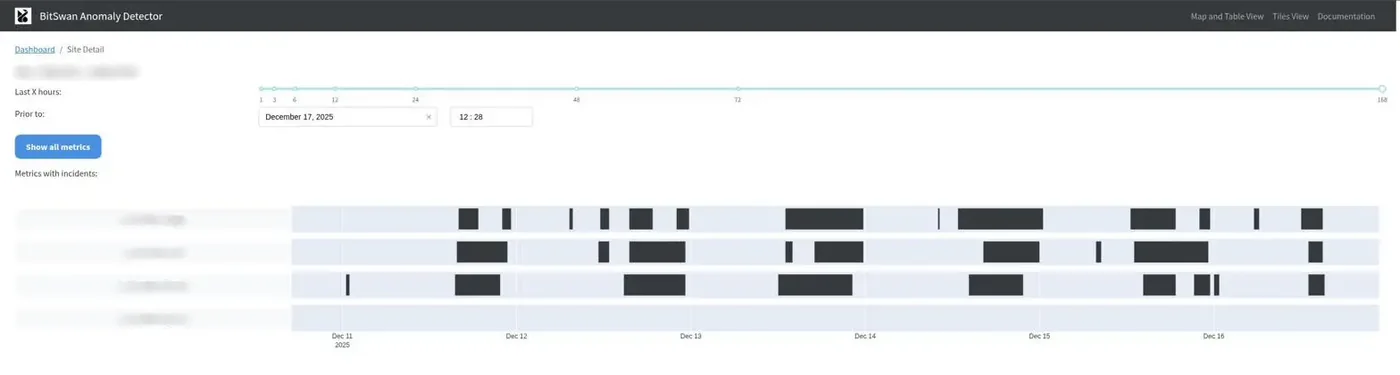
Per-metric anomaly timeline.Every monitored KPI on a grid — dark blocks are windows the models scored as anomalous. Patterns become visible at a glance.
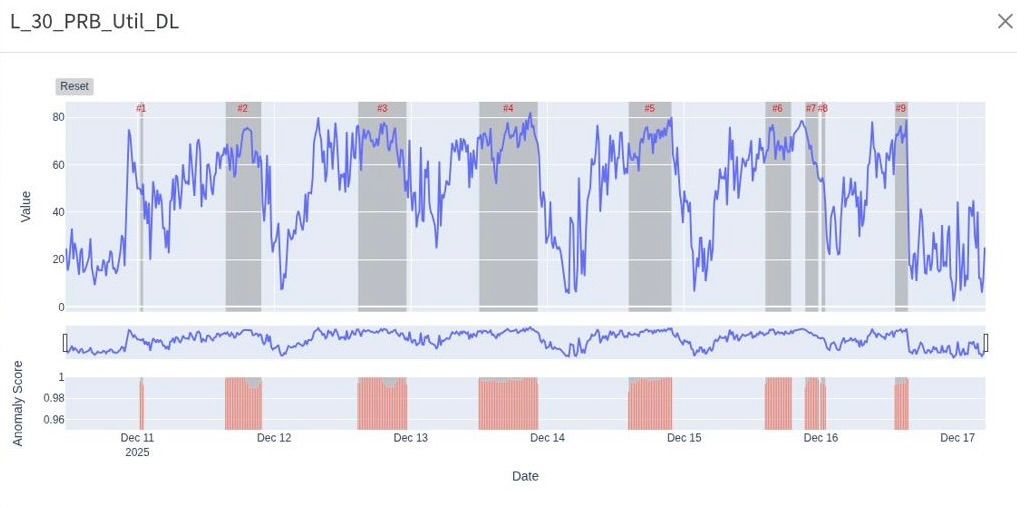
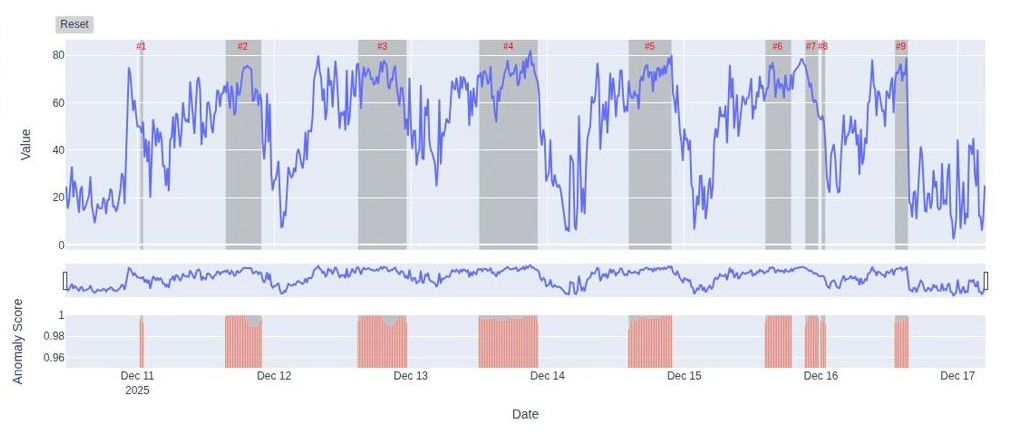
Incident review. L_30_PRB_Util_DL with anomaly scores over time and the incident list. Operators classify each as Legitimate, Suspicious or Anomaly — feedback flows back into the system.
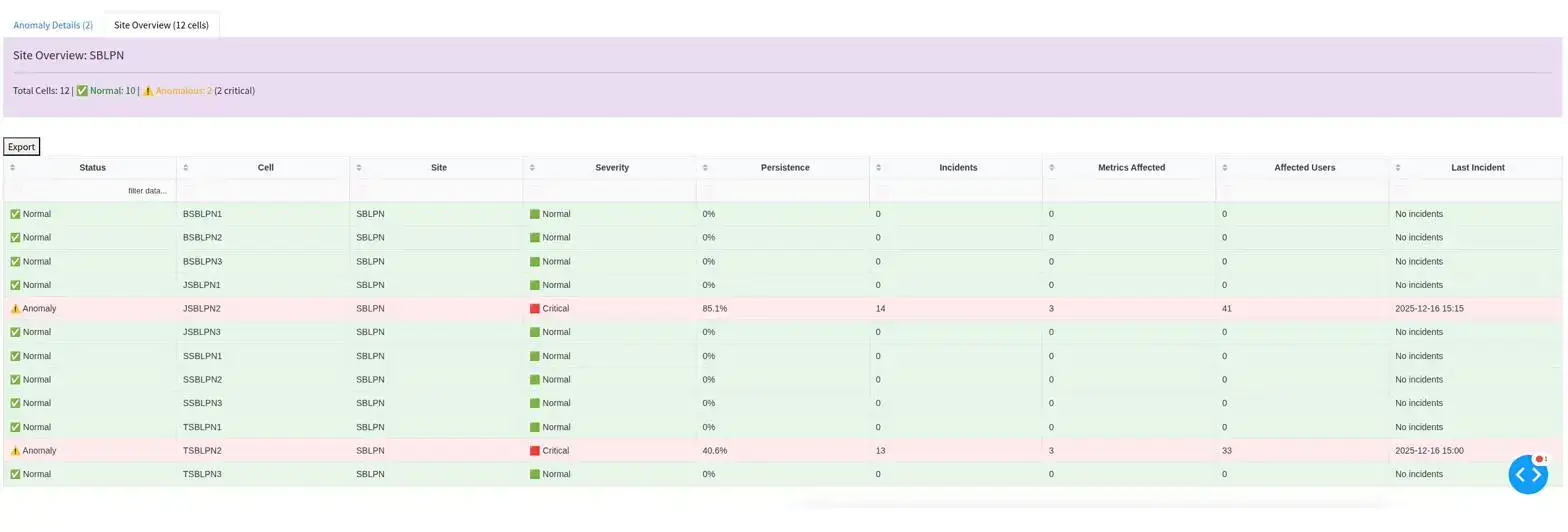
All cells on the affected site.The same afternoon pattern shows up across multiple cells of one sector — a site-level cause, not a one-off.
Screenshots come from the production system and will be anonymised before public launch.
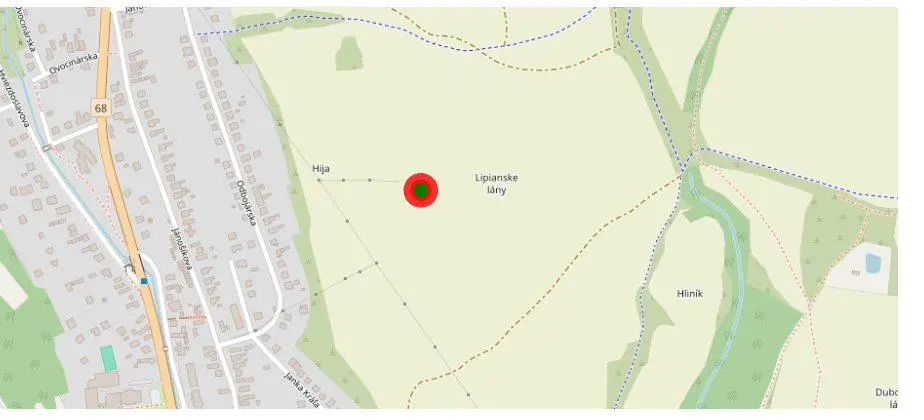
Where it happens.The flagged site on the map — a village where the pattern matches people returning home from work.
See it on your data.
A 60-minute walkthrough of the live use cases — and a frank conversation about which of them would land first on your network.