
Customer & Ops
TESU — the technical-support cockpit
Everything about one customer's connection on one screen: antenna, router, signal, site and cell health with anomaly flags, 30 days of history, and remote actions — plus an AI assistant being built on top.
CETIN SK — production
1 screen
per customer — device, radio, site and history consolidated from a dozen sources
30 days
of site and connection history visible during the call
Remote
reboot, reset and reconfiguration actions directly from the cockpit
At a glance
Status: Live
Deployed at: CETIN SK — production
Domain: Customer & Ops
Built with: GenieACS · SBR/OSSR · RAN KPIs · Speedtests · BitSwan dashboards
What it does
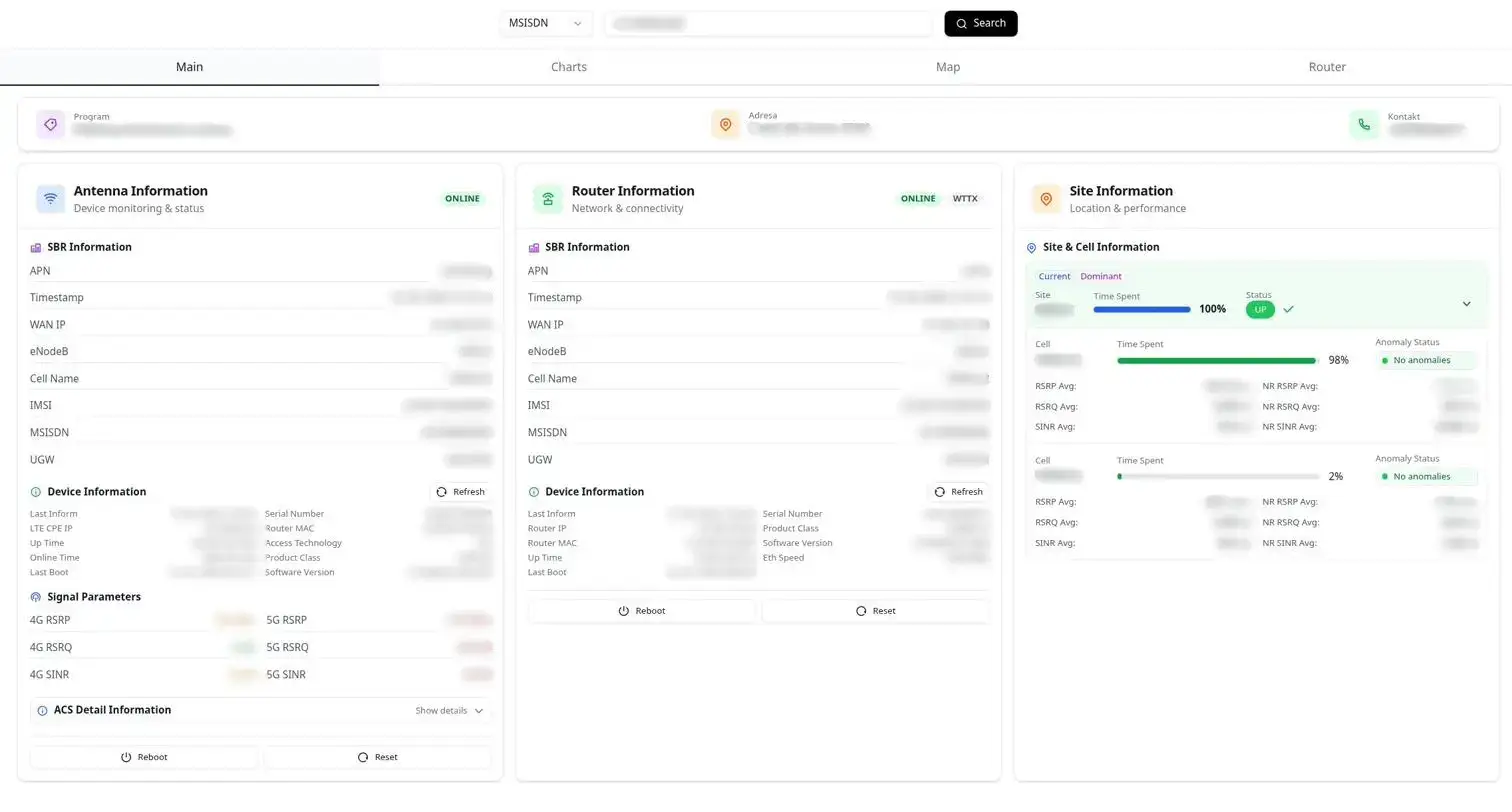
TESU gives technical support and the NOC a single cockpit per customer connection. Look up an MSISDN and you see, in one view: the antenna and router state from ACS, where the customer is connected (SBR/OSSR), live and historical radio quality, the health of the serving site and cells including anomaly-detection flags, speedtests, WiFi clients — and buttons to reboot or reset the CPE remotely.
Why it matters
The expensive part of a support call is not the talking — it’s the swivel-chair time across half a dozen systems while the customer waits. TESU collapses that to seconds, and changes the kind of answer an agent can give:
Diagnose during the call — “your router is fine; your serving cell has been congested every evening this week” is a one-glance conclusion.
Separate device from network — anomaly flags on the site/cell instantly tell the agent whether this is a truck roll or a capacity issue.
Act immediately — remote reboot/reset without escalation for the cases that need it.
How it works
BitSwan connectors continuously ingest ACS (GenieACS) device updates, SBR/OSSR connection records, RAN KPIs, speedtest results and CPE measurements into Kafka; pipelines join them per customer and per site, and the TESU application serves the consolidated view with role-based access through Keycloak/AD. The anomaly-detection use case feeds its verdicts straight into the site and cell panels.
The next layer: an ops assistant
An AI assistant is being built on top of TESU and the wider operations cockpit — chat over incidents, KPIs, alarms and customer impact, with guided automations that always keep a human approval in the loop and an audit trail behind every action. The core platform for it is already live; the assistant experience is in active development.
Why it replicates
TESU is an integration pattern, not a bespoke app: every operator has an ACS, a subscriber registry, RAN KPIs and some speedtest capability. The connectors for all of these already exist — replication is configuration plus your branding, not a rebuild.
From the live system
Screenshots
The cockpit. One customer (by MSISDN): antenna, router, SBR and signal status, site & cell health with anomaly indicators, remote reboot/reset actions.
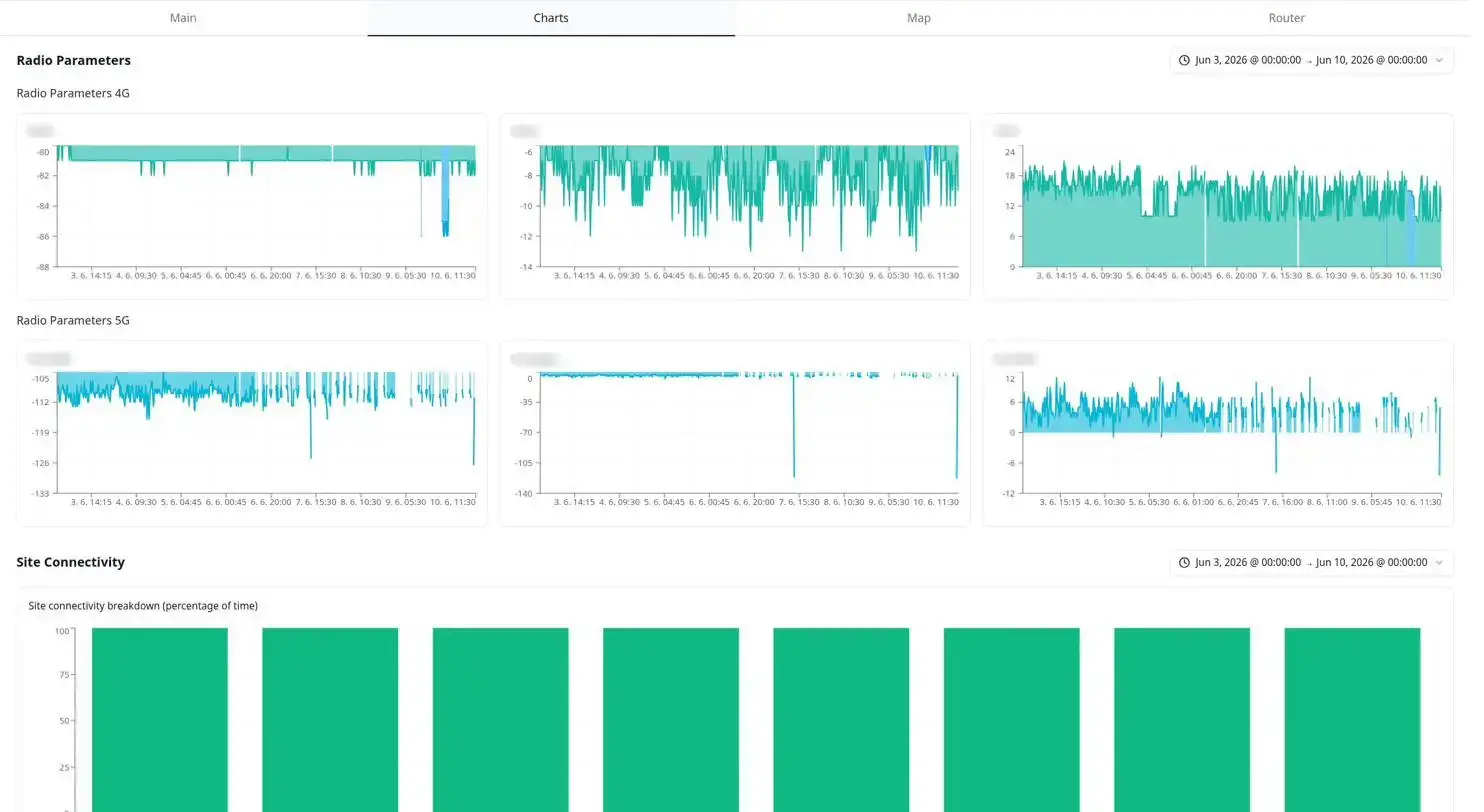
Radio history. RSRP / RSRQ / SINR time series for 4G and 5G plus site connectivity — agents see when it got worse, not just that it’s bad now.
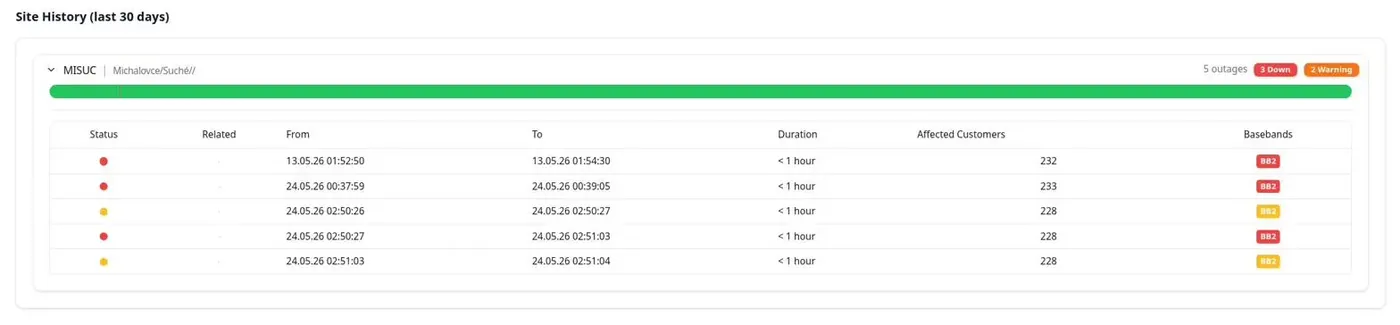
Site history (30 days).Outages and degradations on the serving site with duration and affected-customer counts.
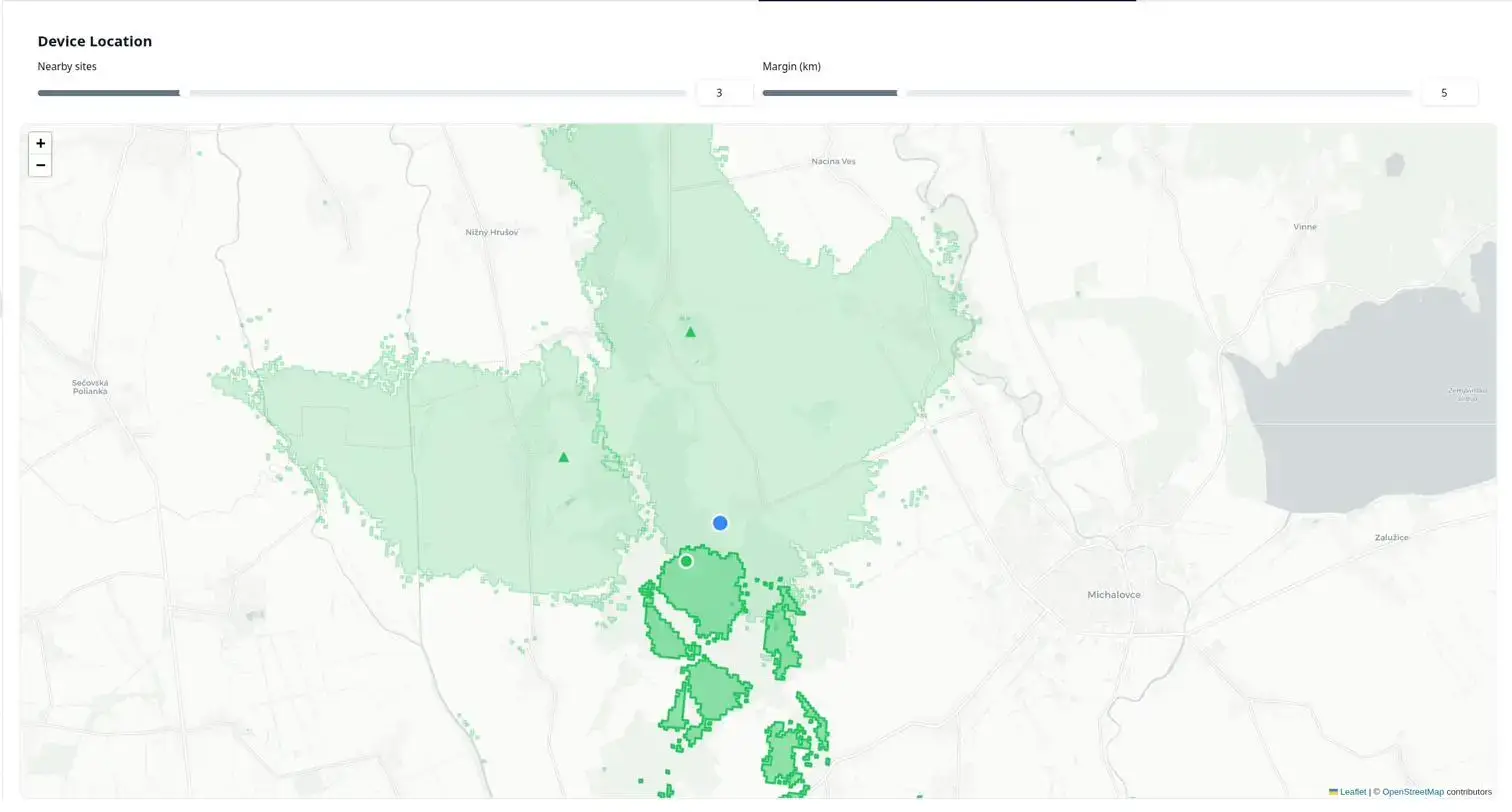
Device location. Where the customer’s device actually connects — coverage reality instead of coverage theory.
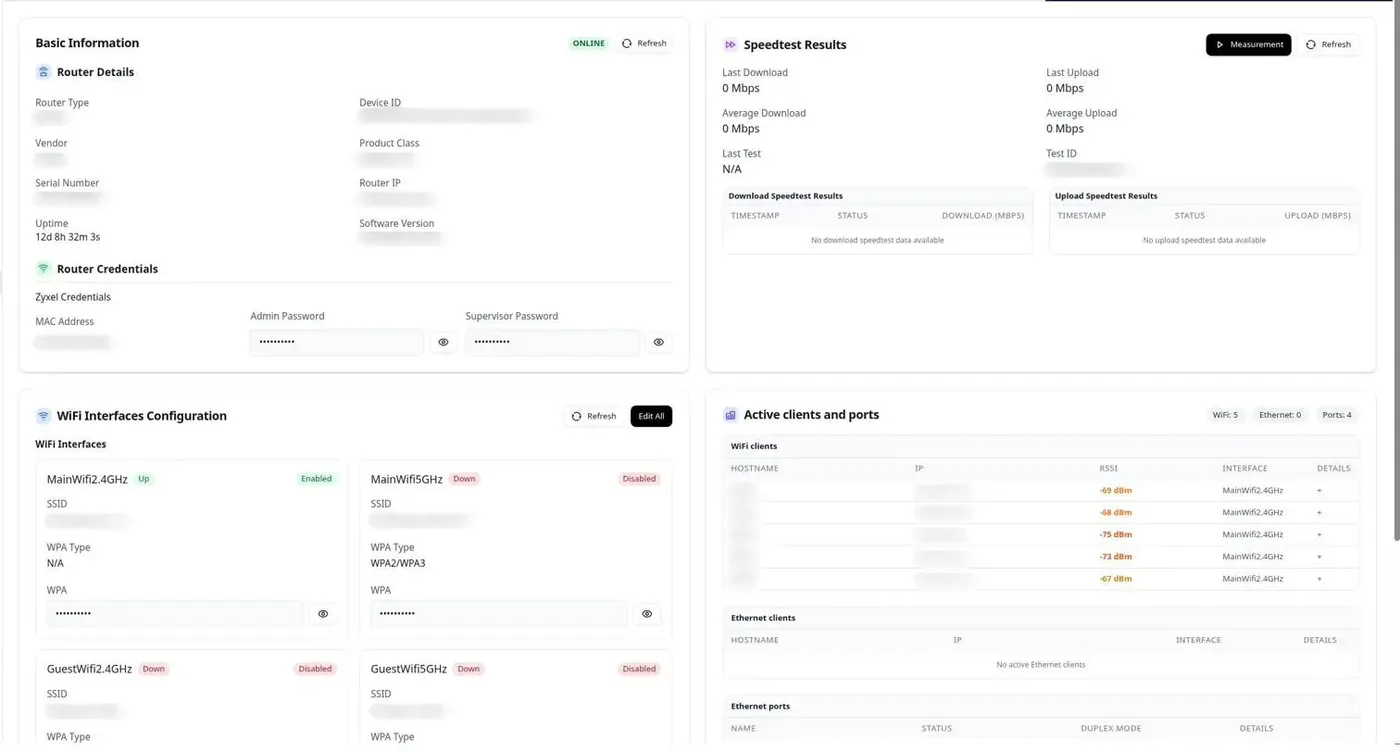
Router detail. Speedtest results, WiFi configuration, active clients and ports — the full CPE picture without a second tool.
See it on your data.
A 60-minute walkthrough of the live use cases — and a frank conversation about which of them would land first on your network.